Data Science Enthusiast | Python & SQL Expert
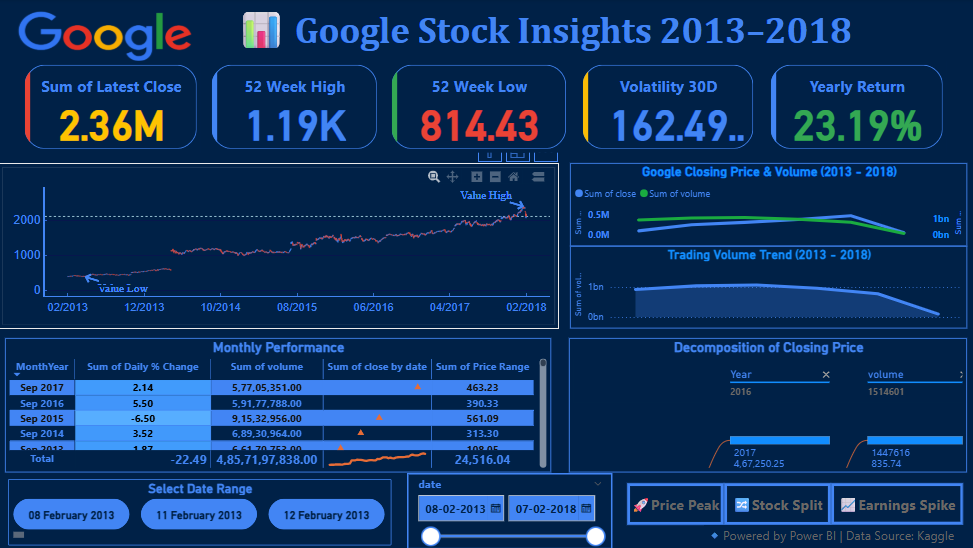
Hire MeCreated an interactive Power BI dashboard to visualize Google’s stock trends from 2013 to 2018 using Kaggle data. It highlights key metrics like latest close, 52-week high/low, volatility, and yearly return. The dashboard includes dynamic charts, monthly performance tables, and event markers for stock splits and price spikes. With interactive filters and decomposition visuals, this project demonstrates my skills in financial analysis, data storytelling, and dashboard design using Power BI.
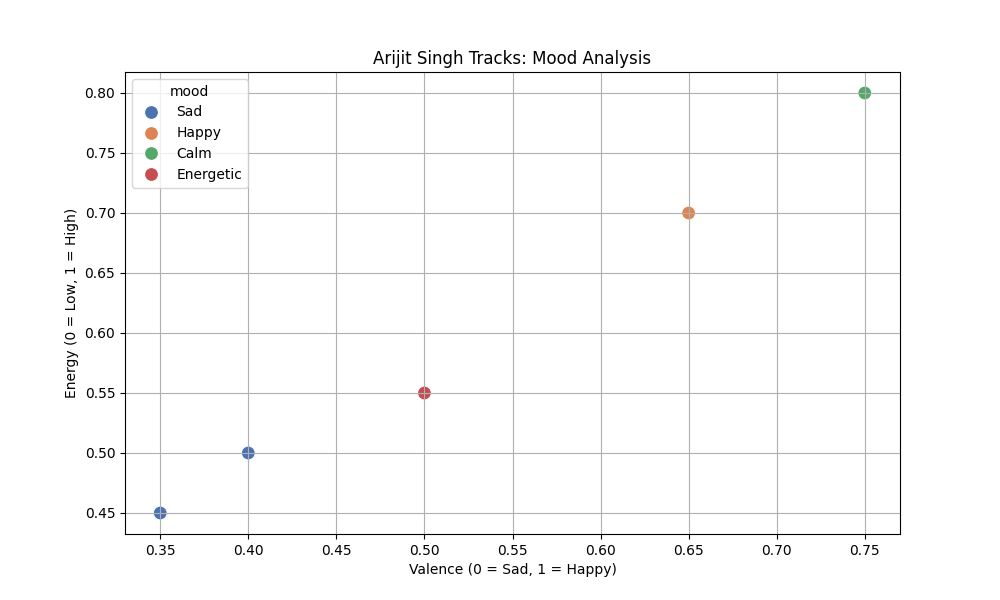
Built a data-driven Spotify Mood Analytics dashboard using Power BI to explore how audio features like valence, energy, danceability, and tempo influence the emotional tone of songs. The project uses a Spotify dataset to classify tracks by mood (e.g., Happy, Calm, Energetic) and visualizes trends across genres, popularity, and release years. Interactive filters allow users to explore mood distributions and feature correlations, showcasing my skills in music data analysis, clustering, and insightful dashboard design.
I'm excited to connect for data science projects, freelance work, or innovative ideas. Reach out via: